


If you’re a data driven professional, in all likelihood this episode is for you.
There are also some interesting analysis techniques I came across this week, that I thought I’d share. Check them out at the end of this email below !!!Do subscribe to the newsletter if such topics interest you! No Spam, ever!
On the show today JPK and I got a chance to speak with Shripati Acharya, Managing Partner at Prime Venture Partners on how to measure various SaaS Metrics and why valuations are a geometric function of growth. An astute mind, I’m just surprised how calm successful people like him are and they way they structure their thoughts so well.
Of the many cool things Shripati shares, here were my top 3 learnings from him:
A better way to measure LTV
 | How to Calculate & Improve It")
As common as this metric is, it is also the most mistaken one.
Broadly Lifetime Value or LTV is a measure of how valuable a product is to a user. At the very basic level it can be defined as the Average Revenue Per User (ARPU) divided by the churn. The numerator is a signifier of how much value the product has to the client/user over an average contract period. Shripati argues that instead of using revenue, one should use contribution margin in the numerator. Using ARPU would imply a $1000 product with 10% CM and a $1000 product with 20% CM have the same LTV. But this false sense of pegging value to revenue can lead to costly errors in customer acquisition, he argues.
Next, the denominator relates to the customer lifetime. The lower the churn, the higher the customer lifetime. As Sripathi puts it, “If monthly churn is 10%, customer lifetime is 1/0.1. = 10 months. Meaning in 10 months substantially all the customers acquired today would leave (pretty bad business).”
But there is a problem here. Shripati has written quite extensively on this before:
Startups frequently arrive at pretty attractive customer lifetime figures in their initial days. If a service launches and in the first 6 months only 5% of customers churn, it appears like the startup has achieved a 10% annual churn or a 10 year customer lifetime! Calculating customer lifetime by inverting churn can lead to sky-high customer life-times. Early data does not truthfully reflect customer behaviour over the long term and also suffers from skew due to early adopter behaviour being very different from mainstream users
This can lead to all kinds of disastrous downstream effects such as investing in expensive sales channels that soon prove to be uneconomical.
His advice:
Early-stage startups should focus more on customer payback, ie the time period for recovering customer acquisitions cost (CAC), than calculated LTV. In the absence of customer data, using a sub-24-month payback to inform the choice of sales and marketing strategies is prudent.
Companies A & B have same revenue today, A’s revenue growth rate is 2x of B’s. Why should B be valued 4x/8x/ possibly16x of B?
The chart below from a paper by Morgan Stanley, ‘The Math of Value and Growth’ (link here) shows that the relationship between growth and the P/E is convex. Small changes in growth expectations can lead to large changes in the P/E, especially when growth rates are high.
The key point is that a company growing faster should enjoy a multiple that grows geometrically with the growth rate, not linearly.
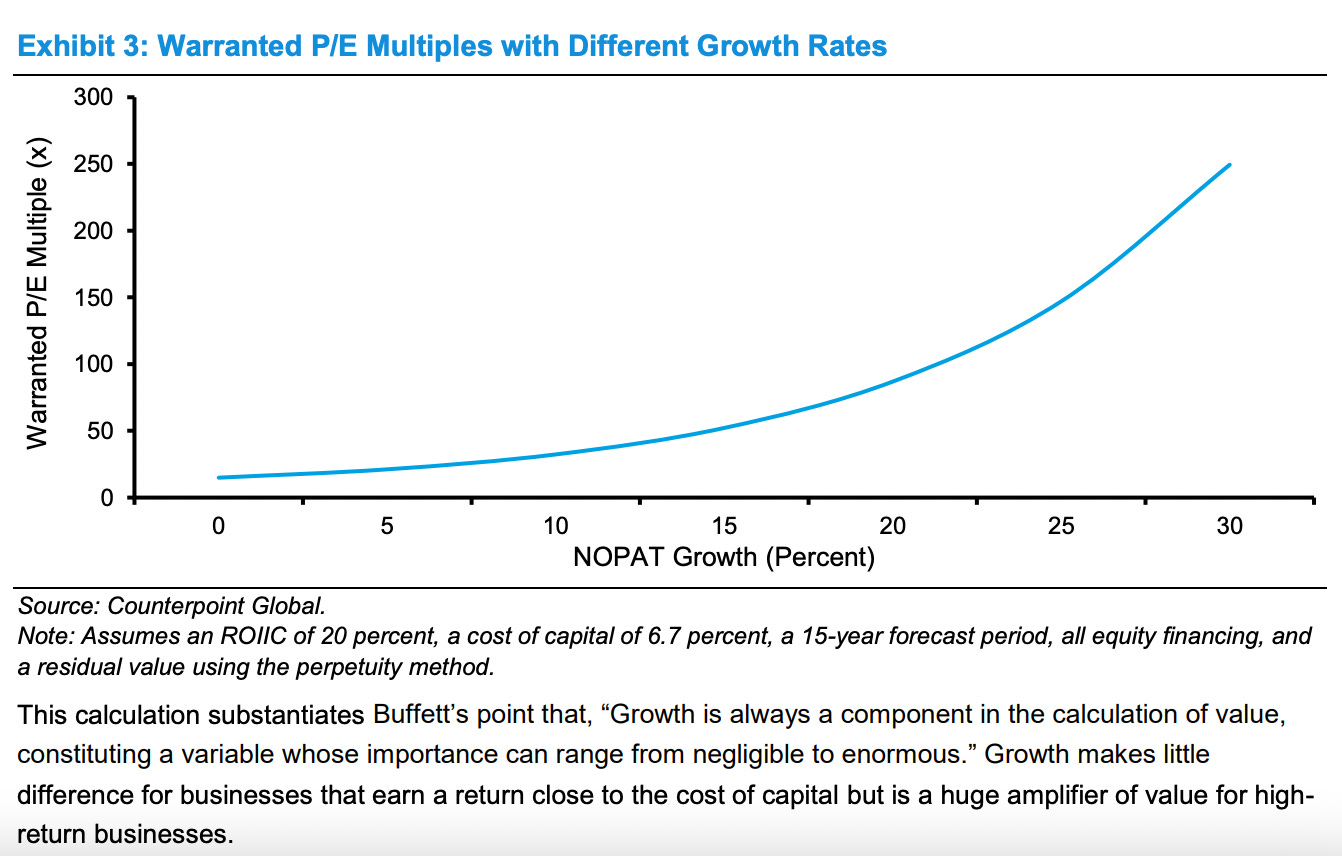
This is why SaaS companies that make the same revenue can have very different valuations - and as Shripati notes founders need to recognise this before asking “Why is that company valued so much and not mine?”
How much is 20% NDR worth in the long run?
In a similar context, JPK also made an important observation of how important Net Dollar Retention or NDR is to SaaS companies.
Imagine three companies: one at 120% NDR, one at 140% NDR and the last at 160% NDR. In five years, assuming all else is equal, how much bigger is the last company than the first?
The answer is 4.2x - four times bigger! Each marginal 20% of NDR is a doubling of company ARR in 5 years!
Some interesting links/ readings to help you do better data analysis:
Using RFM analysis to derive customer insights: RFM analysis is a customer behavior segmentation technique. Based on customers’ historical transactions, RFM analysis focuses on 3 main aspects of customers’ transactions: recency, frequency and purchase amount. These 3 key behaviors can do wonders to analyse the business. Check out this post for how it works: https://towardsdatascience.com/simple-customer-segmentation-using-rfm-analysis-1ccee2b6d8b9
Two Methods of estimating LTV with a spreadsheet: A nice summary of how you can go about modelling complex scenarios to come up with a measure of LTV using simple excel. Linked to within the presentation is a spreadsheet that showcases examples of the models discussed, each built on a data set of 100,000 rows of fake user profiles. Check it out: https://www.slideshare.net/EricSeufert/ltv-spreadsheet-models-eric-seufert


How to measure and value a SaaS company? With Shripati Acharya, Prime Venture Partners